Home Learn with it Download it
The chart stands by itself and contains all the information you need to use it. However, along with the chart itself, you will get added benefit if you use the Acrobat reader version (free download) and the Learning earth science with The Natural Year page of this site.
|
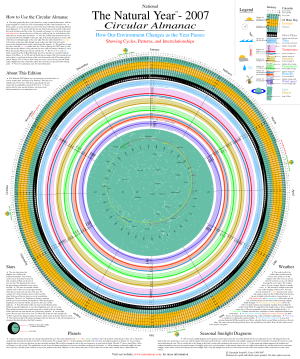
The chart shows the year passing day by day clockwise around the outside of the circle. The outer 24 Hour Day band shows rise and set data. Inward from that are the moon phases and tides, then come the weather bands. There is a star chart at the center, including the positions of Venus, Mars, Jupiter, and Saturn. | |
| The upper right corner contains the legend. The legend is a slice taken from the top center of the chart and shows the position of each of the different data items. It is the single best way to understand the chart. See the next section for a detailed view of it. | ||
| The upper and lower left corners and the lower right corner contain explanations and background information. The upper left corner has an overview of the chart and information about the specific edition. The lower left corner described the star chart and the planet paths. The lower right corner describes the weather and the equinox and solstice diagrams. |
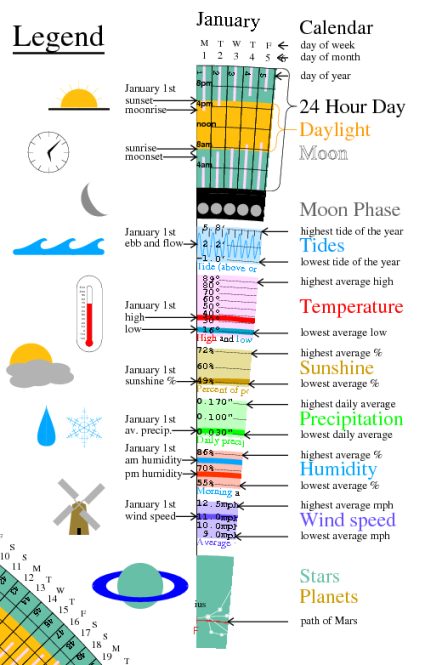
Here is a detailed full size image of the legend, found in the upper right corner of The Natural Year Circular Almanac. The text on the right is from the "How to Use the Circular Almanac" section of the chart.
|
To see the data for any day, find the day on the outside of the circle, then read inwards toward the center. For example, on January 1st, at the top of the chart, high temperatures are near the lowest of the year, while on July 1st, at the bottom of the chart, they are nearing their maximums. Also, the 24 Hour Day band shows the day passing outward from midnight on the inner edge of the band, through noon in the center of the band, to midnight again on the outer edge. Thus the yellow band shows daylight, with sunrise on the inner edge through sunset on the outer edge. Note how much narrower the daylight band is in the winter than in the summer. The pink bars in each day show the moon, with moonrise at the inner end of the bar and moonset at the outer end. Thus on January 6th there is a new moon because the moon is rising and setting with the sun, while on January 20th there is a full moon because the moon is rising when the sun sets, and vice versa. The Moon Phase and Tide bands, inward from the 24 Hour Day band, show how the tides are correlated with the phases of the moon. |
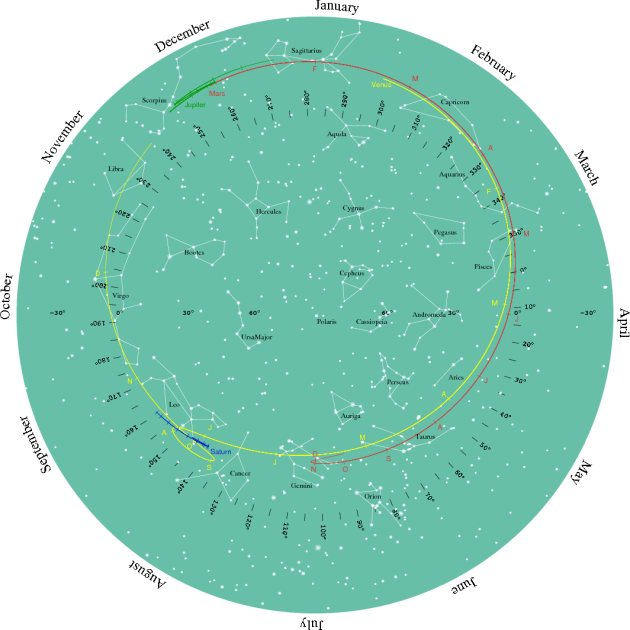
Here is a slightly reduced (3/4 size) and modified image of the star chart in the center of The Natural Year. (This is from the Annual 2007 edition, showing planets for that year. The Perpetual Edition doesn't show planets.) The stars are oriented with the months listed around the chart so that you can tell when they rise and set at any time of the year. For example, let's look at January, shown at the top of the chart. In the top of the star chart we see the constellation Sagittarius. The sun is 'in' Sagittarius in January , meaning that the sun is between the Earth and Sagittarius. When this happens, Sagittarius rises and sets with the sun and we don't see it in the night sky.
Near the bottom of the star chart we find Gemini. Since Gemini is opposite Sagittarius, it rises when Sagittarius sets, and vice versa. Thus in January Gemini rises around sunset and is visible in the sky all night, while Capricorn sets soon after the sun, followed by Aquarius.
Here is an approximate diagram of which stars can be seen at any one time. The larger black circle represents the entire star chart, and the inner blue area represents the portion that is visible at sunset in January. As night passes the stars pass from east to west. To visualize this in the diagram, imagine the blue area rotating clockwise about as fast as the hour hand on a clock.
A planet's position among the stars changes over the course of the year. (The word planet comes from the ancient Greek word for wanderer.) In the star chart, the color-coded red line for Mars shows its position as it moves over the year. The letters positioned along the line show the month when it is in that position. The beginning of the Mars line, between Capricorn and Aquarius. is labeled 'Mars'. As you follow along the line, you come to 'F', showing the position of Mars on February 1st, 'M' for March, and so on for the rest of the year.
Note that the month labels for Venus are never too far from the same month on the outside of the star chart. This is because Venus is closer to the sun than the Earth is, so it is never seen too far from the sun. This is why Venus is the morning star or the evening star. This is described in more detail on the Learning Earth Science page.
© 1998-2006 Joseph B. Casey